1. Preparation: Get Your Template
Your first step is to create a private copy of the Google Sheets template for your own use.
1.1. Click the Template Preview Link
Click the Template Preview Link provided to you.
Preview the Official Template Sheet →1.2. Create Your Copy
In the top-right corner of the page, click the blue Use Template button.
Google Sheets will automatically create a copy in your Google Drive.
Note: The core library is automatically integrated into the template. All features are accessed via the top menu within your Google Sheets document.
💡 Pro Tip: Rename your new sheet immediately (e.g., "Company_Health_Tracker_2025") so you can easily find it later in your Google Drive.
2. Quick Start: Run Sample Data
To see how the tool works before inputting your own data, you can generate a sample assessment.
2.1. Locate the Menu
Locate the Customer Health(On-Premises) menu in the top bar.
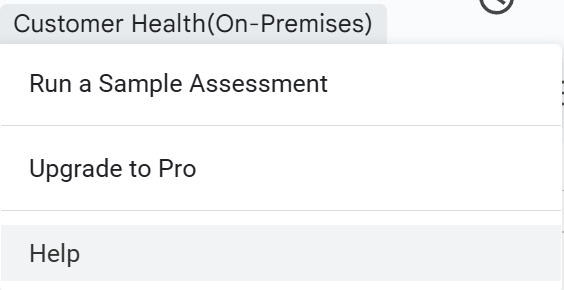
Figure 2.1: Free Menu Interface
2.2. Run Sample Assessment
Select Run a Sample Assessment.
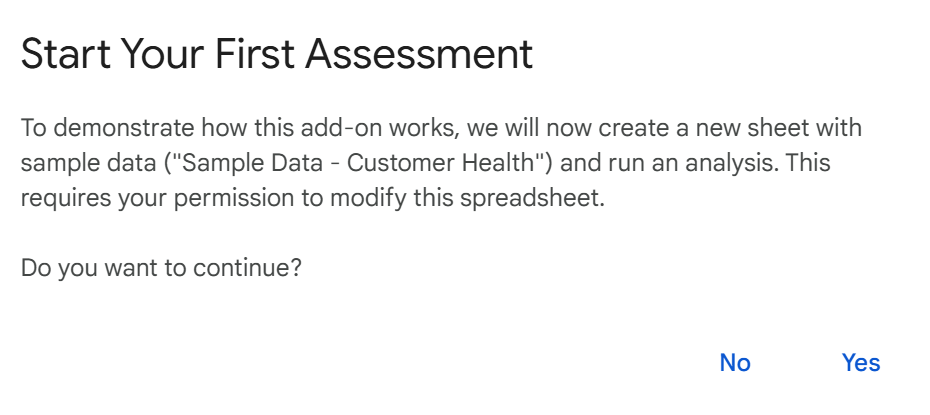
Figure 2.2: Run Sample Assessment Operation
2.3. First-time Authorization
A "Authorization Required" window will appear.
Click Continue → Select your Google Account → Click Advanced → Click Go to Customer Health Tool (unsafe) → Click Allow.
2.4. Generate Sample Data
Once authorized, click the menu item again.
💡 Pro Tip: The sample data is generated in a separate sheet named Sample Data - Customer Health. It won't mess up your actual data sheets. You can delete it later using the "Clean Up" option in the menu.
2.5. Cleaning Up Sample Data
Once you are done exploring, you have two choices:
Option A (Manual)
Right-click the Sample Data - Customer Health tab at the bottom and select Delete.
Option B (Auto - Recommended)
Proceed to Step 3 to activate your license first. Once you upgrade to Pro and refresh the page, a Clean Up Sample Data option will automatically appear in the menu to remove it for you.
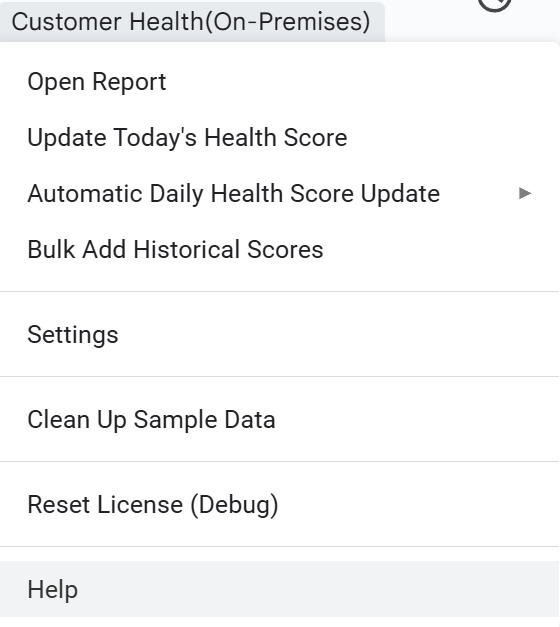
Figure 2.5: Pro Menu Interface
3. Unlock Features: Purchase & Activate License
To access the full reporting dashboard and automation features, you need to activate a Pro license.
3.1. Open Activation Dialog
Click Customer Health(On-Premises) > Upgrade to Pro.
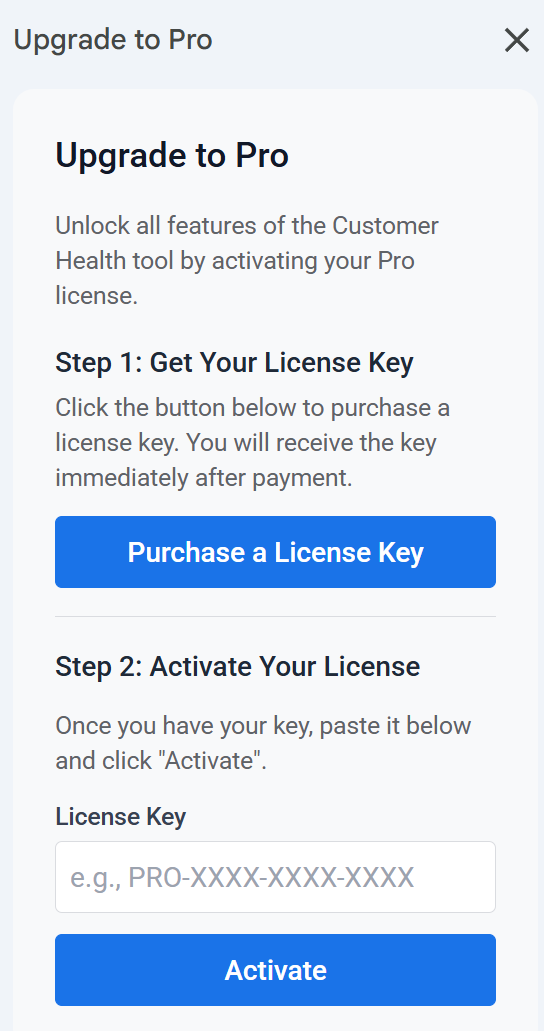
Figure 3.1: Upgrade to Pro Operation
3.2. Purchase License
Click Purchase a License Key to buy a key securely via Lemon Squeezy.
3.3. Activate License
Paste your key into the activation dialog and click Activate.
3.4. Refresh Browser
Important: After seeing "Success!", refresh your browser.
💡 Pro Tip: Keep your license key safe. If you ever need to move to a new Google Sheet file, you can re-use the same key to activate the new document.
4. Tailor Made: Customize Scoring Model (Settings)
Recommended before daily use.
Define what "Healthy" means for your business by configuring Metrics and Weights.
4.1. Open Settings
Click Customer Health(On-Premises) > Settings.
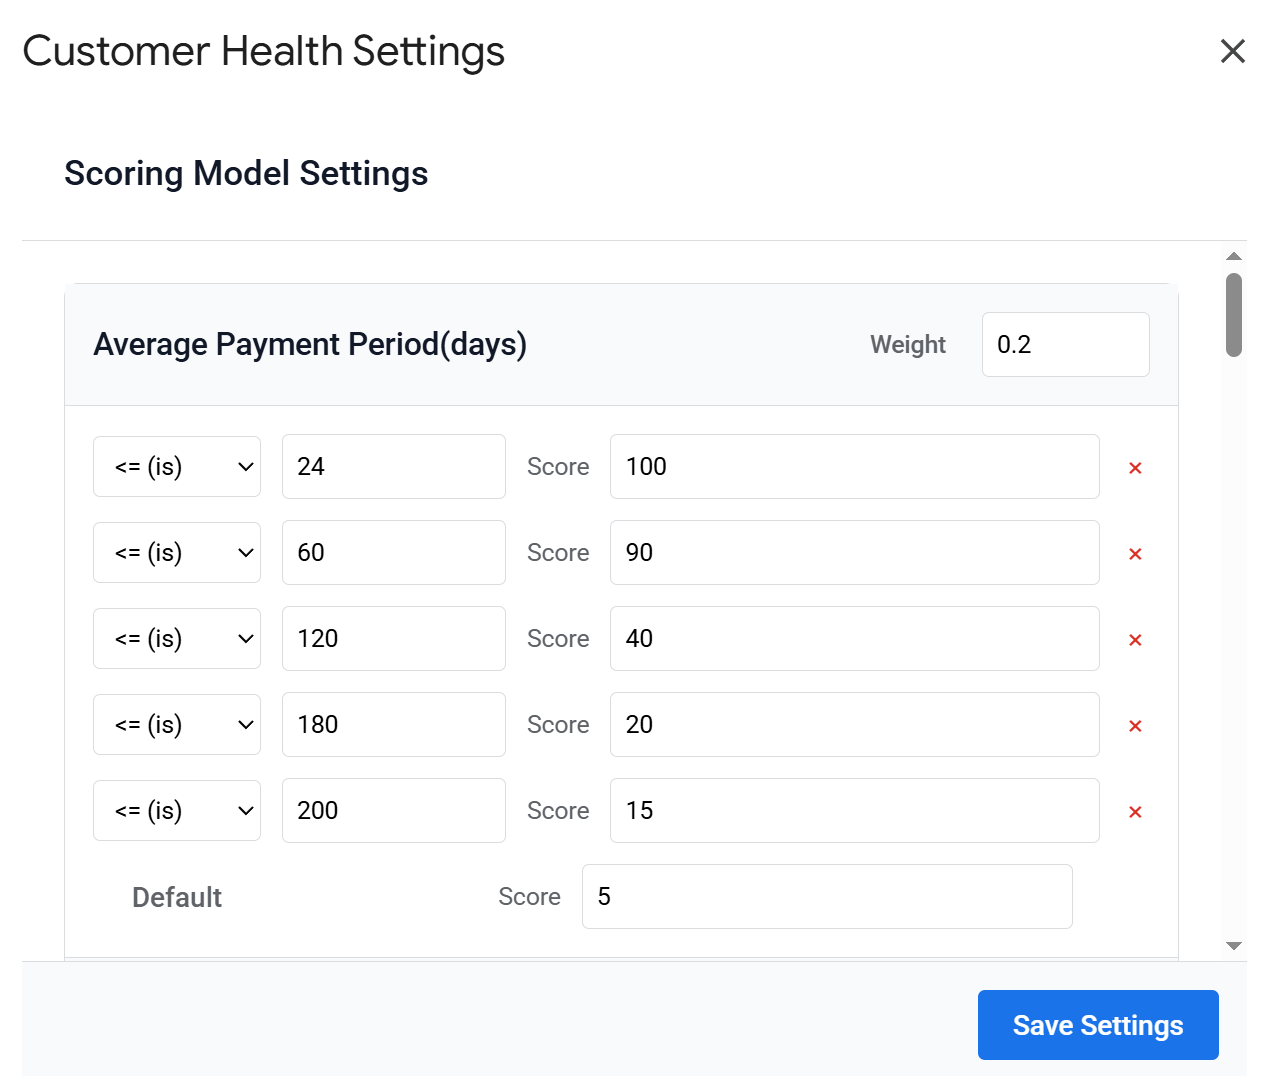
Figure 4.1: Settings Interface
4.2. Configure Criteria
Review the core metrics:
- Average Payment Period (days): Cash flow efficiency.
- Average Order Amount: Customer value scale.
- Collection Rate: Credit and liquidity.
- Profit Margin: Business viability.
- Total Opportunity Amount: Future growth potential.
- Industry Position: Qualitative market standing.
- Service Rate: Special Configuration.
4.3. Calculation Logic
The tool calculates Profit Margin using this priority:
- Direct Calculation: If Order Cost is provided in the data, Margin = (Order Amount - Order Cost) / Order Amount.
- Estimation: If Order Cost is blank, the tool looks up the margin percentage from this "Service Rate" table based on the order's daily rate.
4.4. Adjust Weights and Rules
Adjust Weights: Set the importance of each metric.
Edit Rules: Define thresholds (e.g., Profit Margin > 30% = 100 points).
4.5. Save Changes
Click Save Settings.
💡 Pro Tip: Ensure the sum of all weights equals 1.0 (100%). If it doesn't, the system will prompt you to adjust them before saving.
5. Data Entry: Orders & Payments
Accurate data entry in the Orders, Invoicing & Payments sheet is the foundation of this tool. This sheet tracks two distinct types of transactions: Invoices (billing) and Payments (collection). You must specify the type in the Transaction Type column.
5.1. Access Data Entry
Navigate to the "Orders, Invoicing & Payments" worksheet in the document to enter specific business data.
Field Dictionary & Rules
| Field Name | Required? | Description & Rules |
|---|---|---|
| Customer Name | Required | The official name of the client. Must match exactly across all sheets. |
| Order ID | Required | A unique identifier for the contract or order (e.g., ORD-2023-001). Required for both Invoices and Payments. |
| Order Date | Required | The date the order was placed or contract signed. Required for both Invoices and Payments. |
| Order Name | Optional | A short description of the order (e.g., "Q3 License", "Consulting"). |
| Order Amount | Required | The total value of the order/contract. Required for both Invoices and Payments. |
| Order Cost | Conditional | Direct cost associated with the order. • Rule: Fill this if you know the exact cost. If filled, Profit = (Amount - Cost) / Amount. |
| Service Rate | Conditional | The daily rate used to estimate profit if cost is unknown. • Rule: Required if Order Cost is blank. • Rule: Leave blank if Order Cost is provided. |
| Payment Terms (days) | Required (for Invoices) | The agreed number of days for payment (e.g., 30, 60). |
| Invoice ID | Required (for Invoices) | The unique number of the invoice sent to the client (e.g., INV-1001). |
| Transaction Type | Required | Must be either invoice or payment. |
| Date | Required | • For invoice: The billing date. • For payment: The actual date money was received. |
| Amount | Required | • For invoice: The invoice amount. • For payment: The actual amount received. |
| Associated Invoice ID | Conditional | Links a payment to its original invoice. • Rule: Mandatory when Transaction Type is payment. Leave blank for invoices. |
Entry Examples
Scenario A: Recording a New Invoice (Profit calculated via Cost)
You signed a $10,000 contract. You know the direct cost is $6,000.
Scenario B: Recording a New Invoice (Profit estimated via Service Rate)
You signed a $5,000 service contract. You don't track direct costs per project, but the daily rate is $1,000 (which implies a high margin in your settings).
Scenario C: Recording a Payment
The client paid the $10,000 invoice from Scenario A.
| Field | Scenario A | Scenario B | Scenario C |
|---|---|---|---|
| Customer Name | Acme Corp | Beta Ltd | Acme Corp |
| Order ID | ORD-001 | ORD-002 | ORD-001 |
| Order Date | 2025-01-01 | 2025-02-01 | 2025-01-01 |
| Order Amount | 10,000 | 5,000 | 10,000 |
| Order Cost | 6,000 | (Empty) | (Empty) |
| Service Rate | (Empty) | 1,000 | (Empty) |
| Payment Terms | 30 | 15 | (Empty) |
| Invoice ID | INV-100 | INV-101 | (Empty) |
| Transaction Type | invoice | invoice | payment |
| Date | 2025-01-01 | 2025-02-01 | 2025-01-15 |
| Amount | 10,000 | 5,000 | 10,000 |
| Associated Invoice ID | (Empty) | (Empty) | INV-100 |
💡 Pro Tip: For Payment rows (Scenario C), please ensure you fill in the Order ID, Order Date, and Order Amount (matching the original order), along with the Associated Invoice ID. This ensures data consistency for reporting.
6. Daily Use: Update Today's Health Score
Calculate the health score for all customers based on the latest data.
6.1. Ensure Data is Up to Date
Ensure your data in Orders, Invoicing & Payments is up to date.
6.2. Run Calculation
Click Customer Health(On-Premises) > Update Today's Health Score.
Figure 6.2: Pro Menu Interface
6.3. View Results
The system will update the Customer Overview and append a record to Historical Health Score. For detailed information, see the 8. Insight: Health Report section.
💡 Pro Tip: Run this manually after you have batch-imported a lot of new transaction data to see the immediate impact on customer health.
7. Historical Analysis: Bulk Add Scores
Use Case: This feature is designed for first-time users who have historical transaction data and want to calculate past health scores (e.g., "What was the health score for all my clients on Jan 1st, Feb 1st, etc.?") to build a trend line immediately.
7.1. Open Bulk Analysis
Click Customer Health(On-Premises) > Bulk Add Historical Scores. 系统将追加数据至Historical Health Score中。
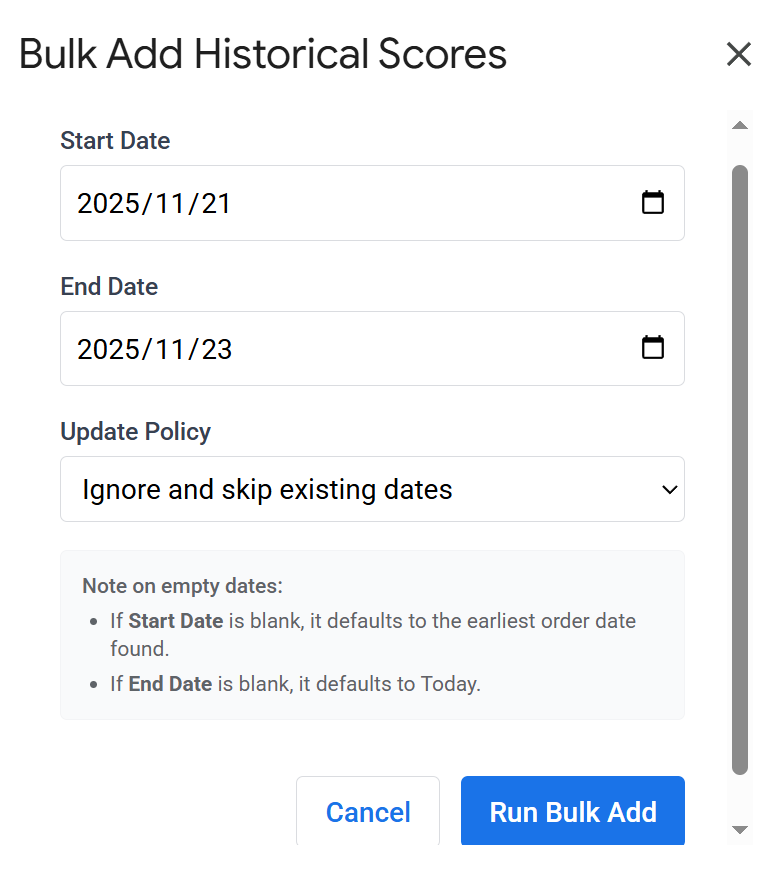
Figure 7.1: Bulk Add Historical Scores Operation
7.2. Select Date Range
A date picker dialog will appear:
- Start Date: Select the beginning of the period.
- End Date: Select the end of the period.
- Update Policy: Choose "Ignore" (skip if data exists for that day) or "Update" (overwrite existing data).
7.3. Run Analysis
Click Run Bulk Add.
Handling Empty Dates
If you leave date fields blank, the system applies the following logic:
- Start Date is Empty: The system automatically scans your data to find the earliest order date and uses that as the start date.
- End Date is Empty: The system defaults to Today.
⚠️ Important Warning:
If you leave dates blank or select a very wide range (e.g., > 1 year), the system will calculate a score for every single day in that period for every client. This process may take significant time. The system will ask for your confirmation before proceeding. Please keep the browser open until you see the "Finished" notification.
💡 Pro Tip: To avoid timeouts, process history in chunks (e.g., 3 months at a time) rather than running 5 years of history at once.
8. Insight: Health Report
Gain deep insights into your customer base using two powerful views.
8.1 Customer Overview (Sheet View)
For a quick, high-level analysis, navigate to the Customer Overview sheet.
- This sheet is automatically updated every time you run a health check.
- It shows the latest health score, category, and key metric values for every client.
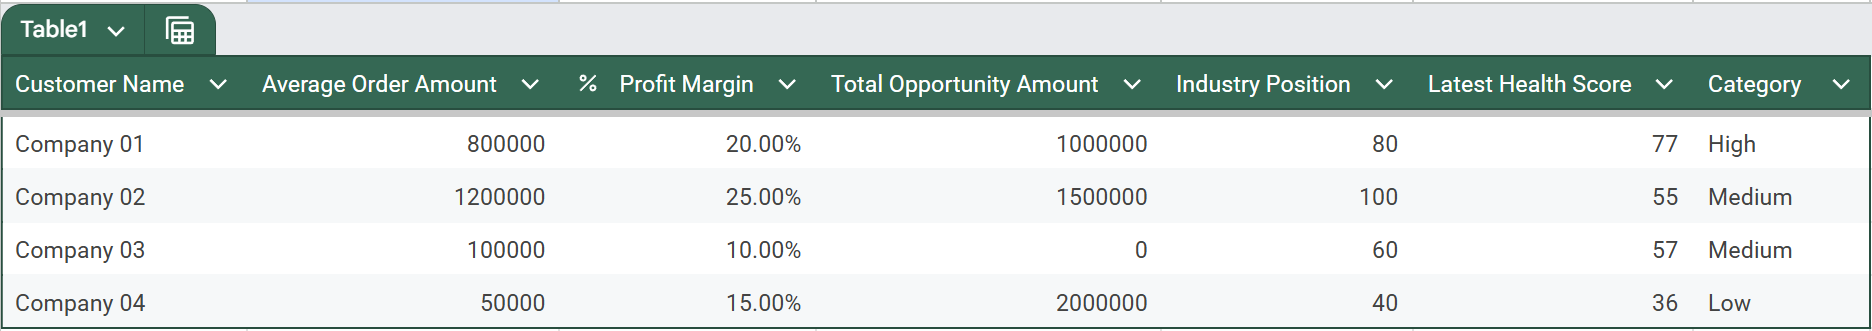
Figure 8.1: Customer Overview Interface
Use Case: Use filters on this sheet to quickly identify "At-Risk" (Low Score) customers or find your "Lighthouse" (High Score) customers for upselling opportunities.
8.2 Health Report Dashboard (Interactive View)
For a deep-dive into a single customer's health profile.
8.2.1. Open Dashboard
Click Customer Health(On-Premises) > Open Report.
8.2.2. Query Data
Select a Customer and Date, then click Query.
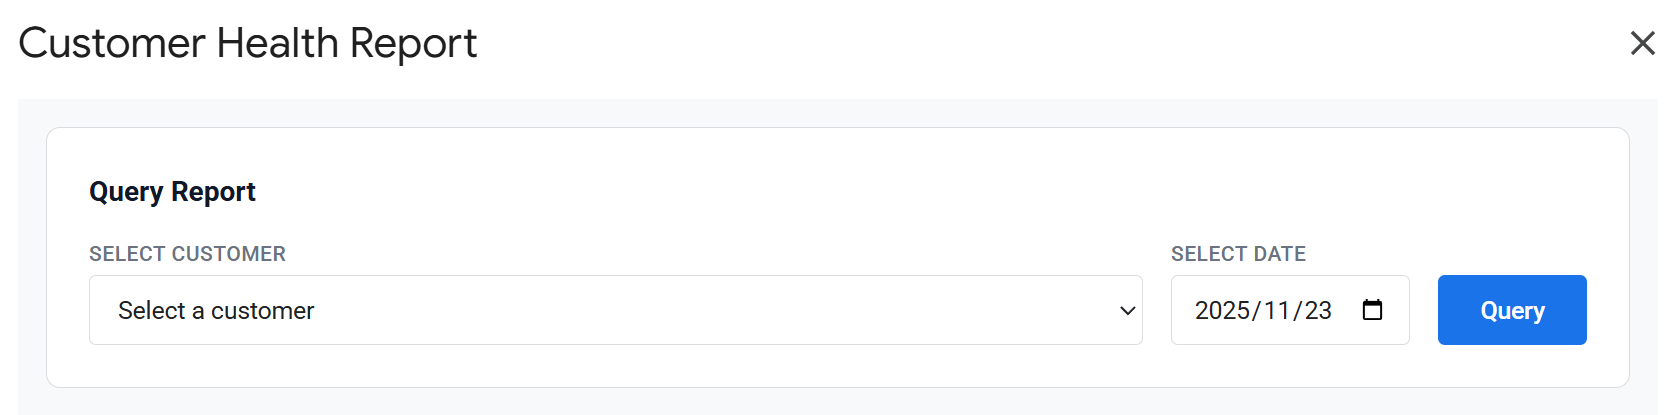
Figure 8.2.2: Customer Health Query Interface
8.2.3. Analyze Results
- Radar Chart: Visualize strengths/weaknesses.
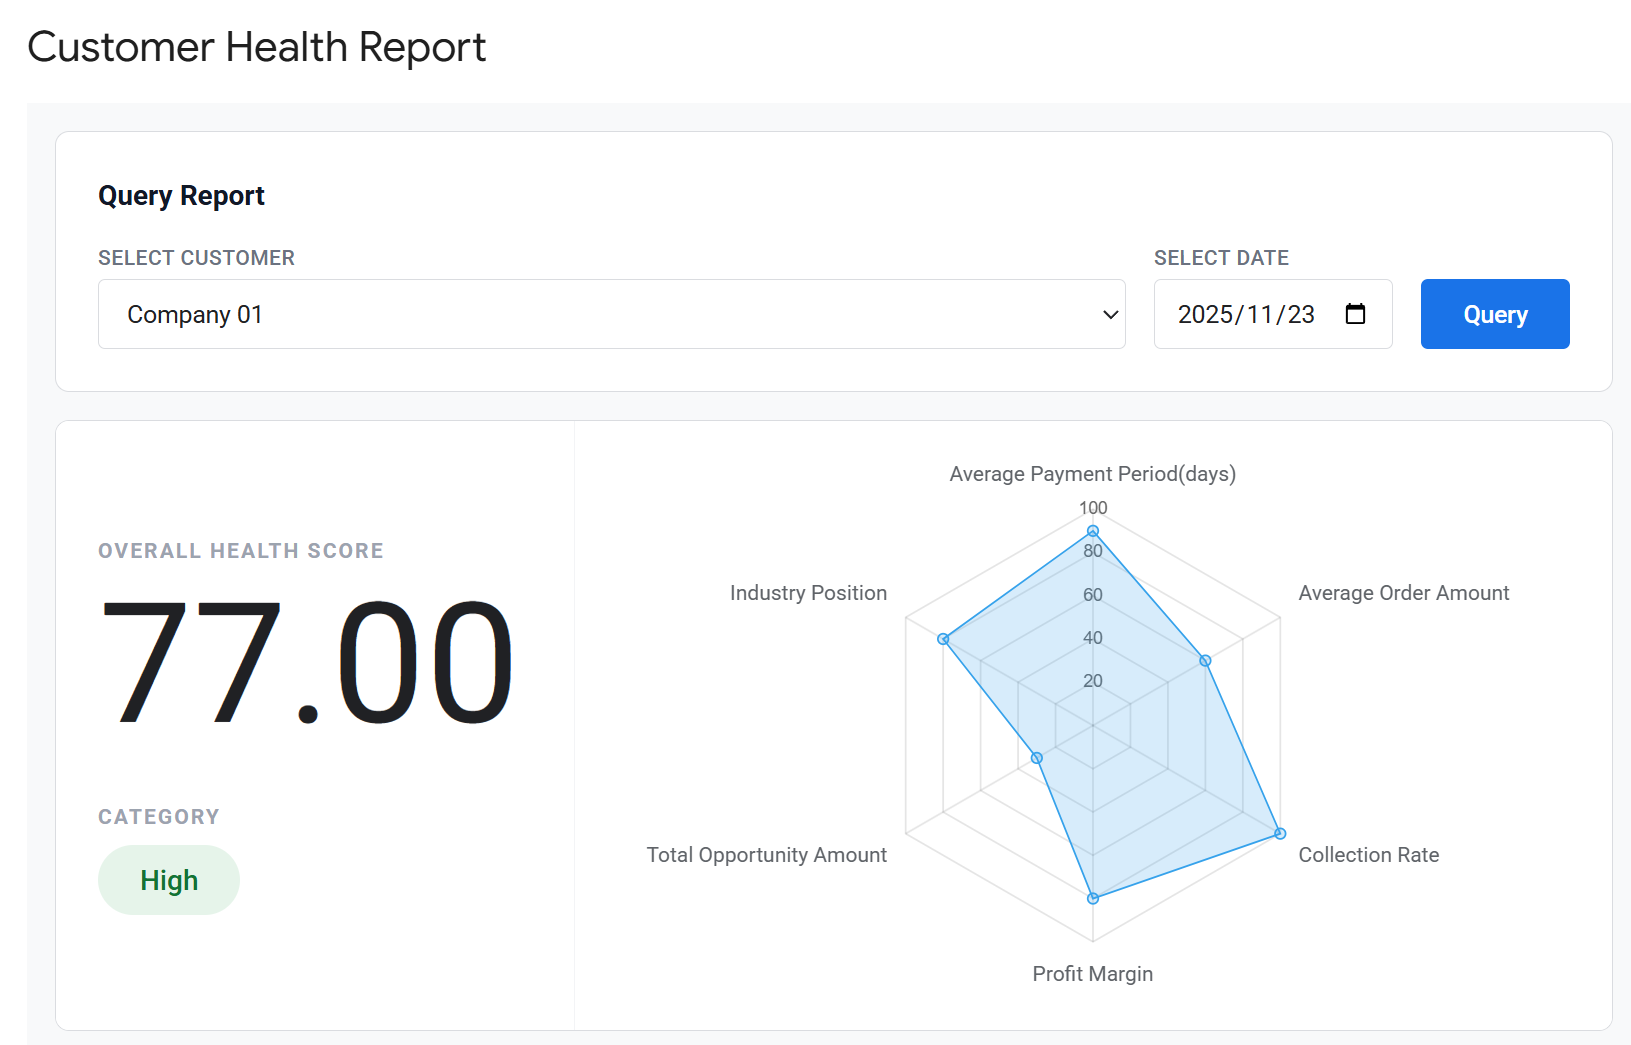
Figure 8.2.3: Radar Chart Interface
- Metrics Breakdown: See exactly why a score is low (e.g., Score is 40 because Payment Period is > 90 days).
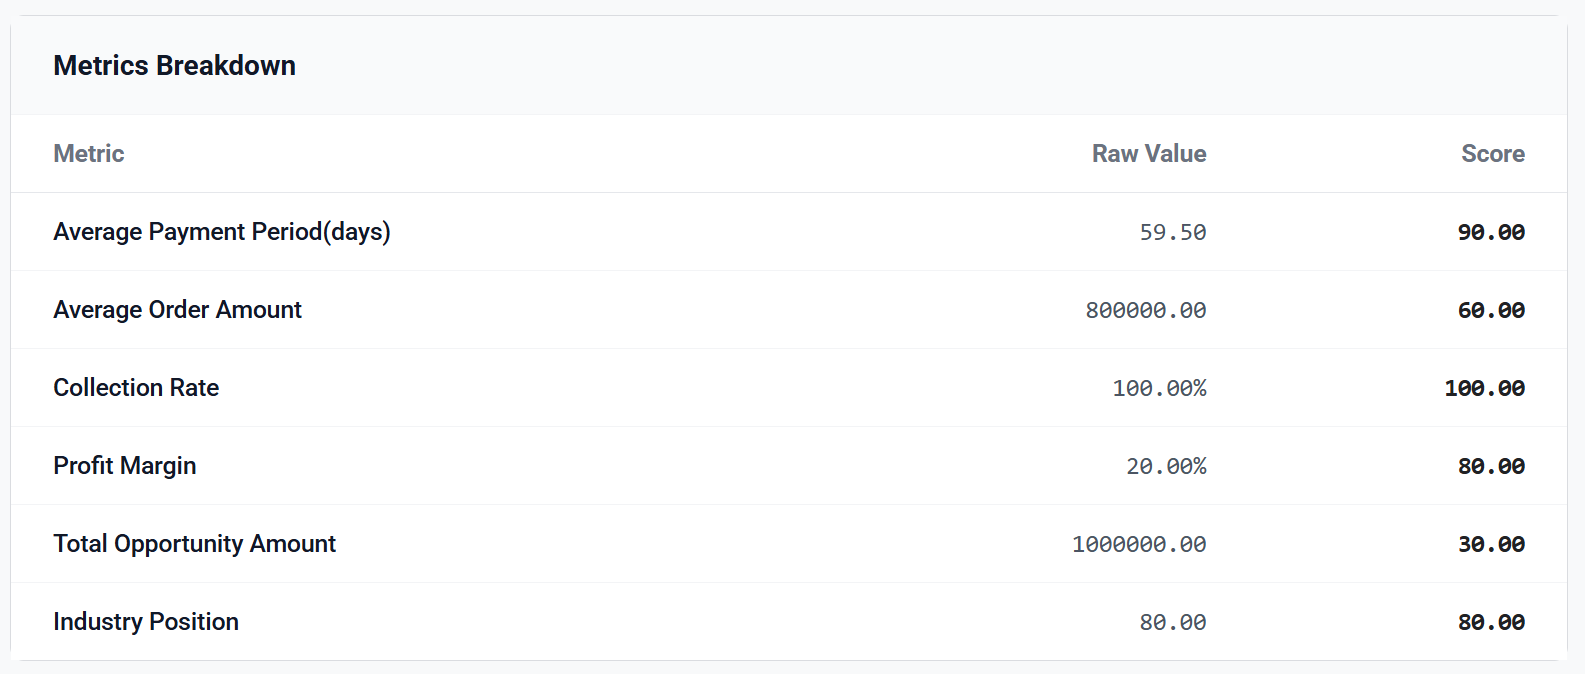
Figure 8.2.3: Metrics Breakdown Interface
- Trend: Use the bottom card to view the history line chart of any specific metric.
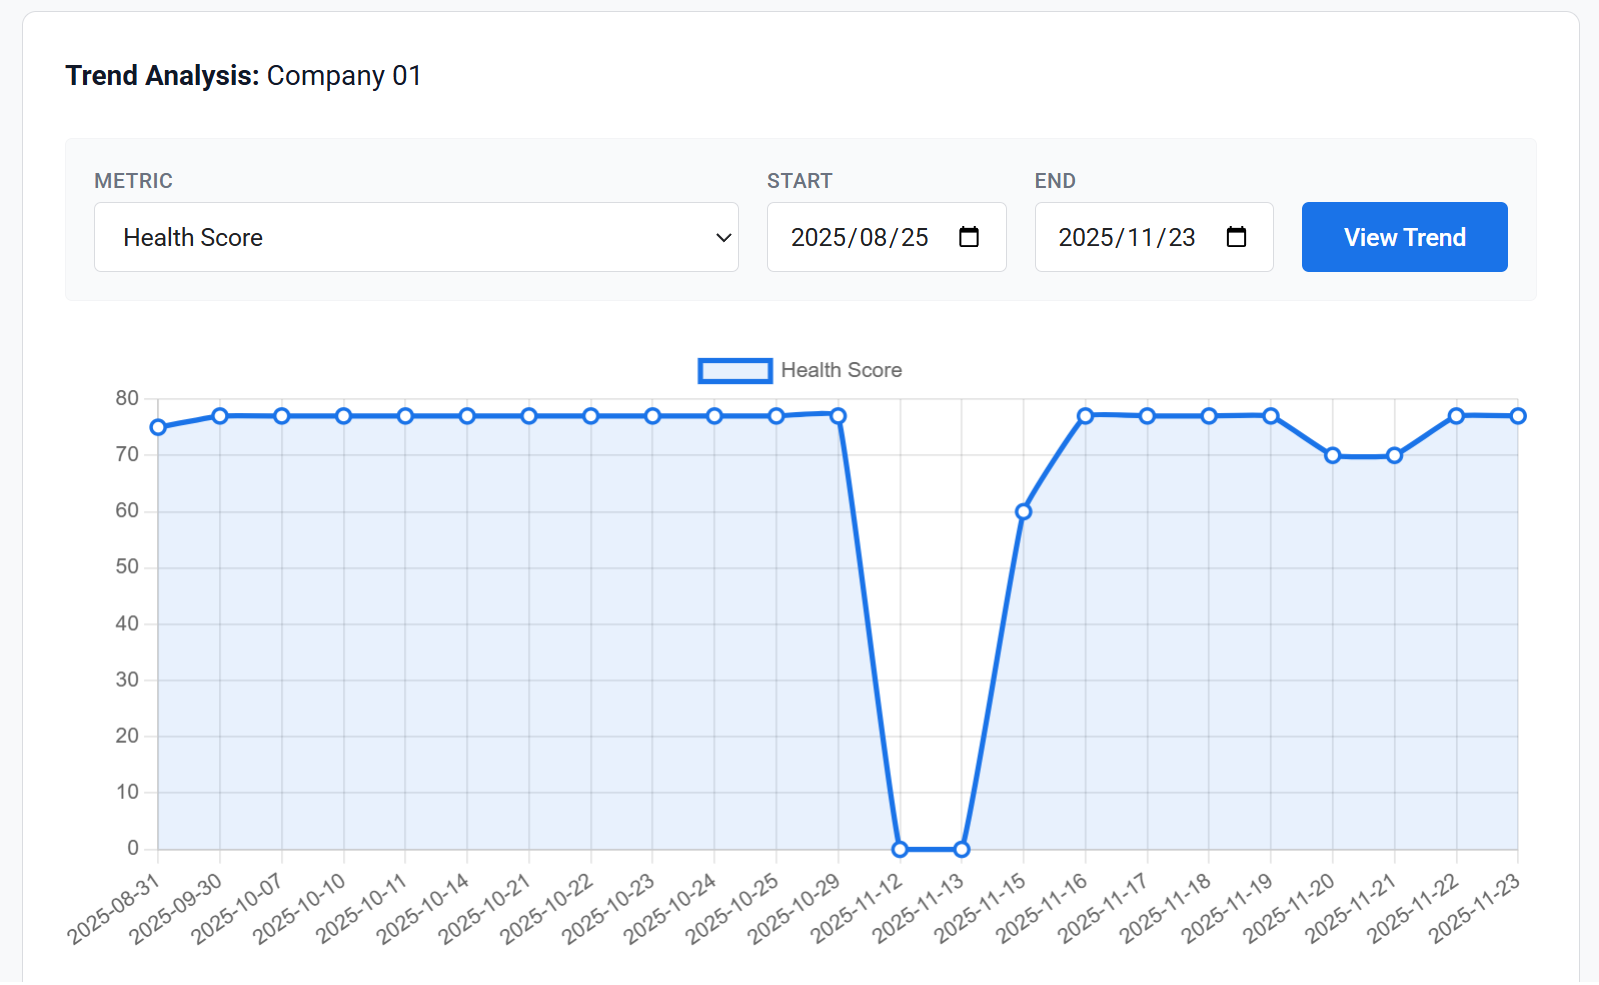
Figure 8.2.3: Trend Analysis Interface
💡 Pro Tip: Use the Trend Analysis to prepare for QBRs (Quarterly Business Reviews). Showing a client that their "Payment Period" trend is improving can be a great talking point.
9. Automation: Enable Daily Updates
Set it and forget it. Allow the system to check your customer health every night.
9.1. Configure Automation
Click Customer Health(On-Premises) > Automatic Daily Health Score Update > Enable.
9.2. Activate
You will see a "Success!" prompt.
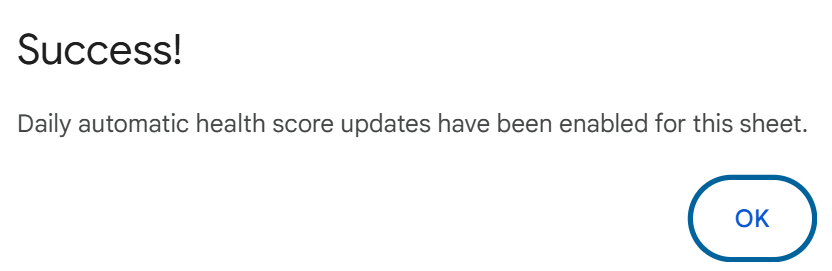
Figure 9.2: Enable Automatic Daily Health Score Update
9.3. Daily Operation
From now on, the system will run the calculation automatically every morning (approx. 1:00 AM). You can disable this at any time using the Disable menu option.
💡 Pro Tip: If the automatic update ever fails (e.g., due to bad data format), the system is designed to handle errors gracefully and will continue to function normally.
10. Contact Support
If you've checked the guides and are still having trouble, please don't hesitate to reach out. We're here to help!
You can contact our support team at: truonghugusa@gmail.com
Please include a description of the problem and, if possible, a screenshot of any error messages or the execution log. This will help us resolve your issue much faster.